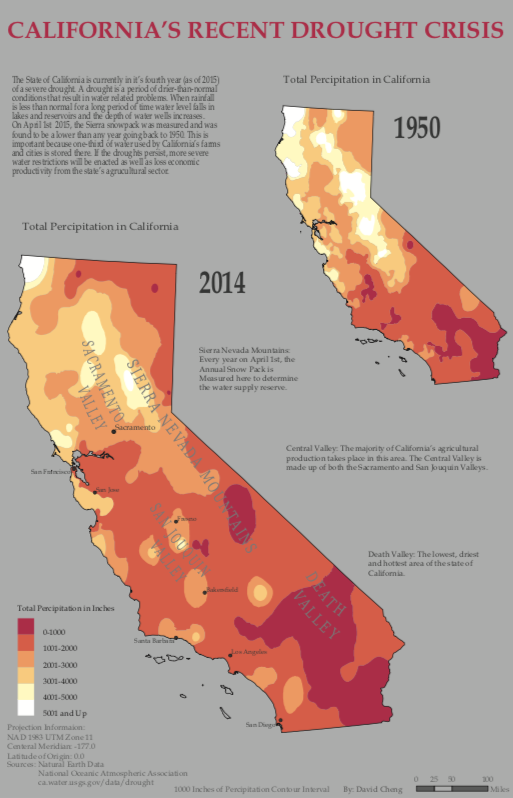
This was my cartography final project. I used ArcGIS, Adobe Illustrator and scientific data from the National Oceanic and Atmospheric Association to create this thematic drought map of California. First, I went to the National Oceanic and Atmospheric Association’s website to track down rainfall data between the years of 1950 and 2014 in California. Then I had to sort the data in Microsoft Excel before uploading it to ArcGIS. Finally, I designed the map by choosing appropriate colors and font in Adobe Illustrator. I used cartography naming and placement conventions to place cities and landmarks in the appropriate places. This was the final product of three weeks of work. The hardest challenges were formatting data into ArcGIS and deciding the layout and placement of objects within the constrained space. The final map measured 11″ x 17″ (27.94 cm x 43.18 cm)..